Project description
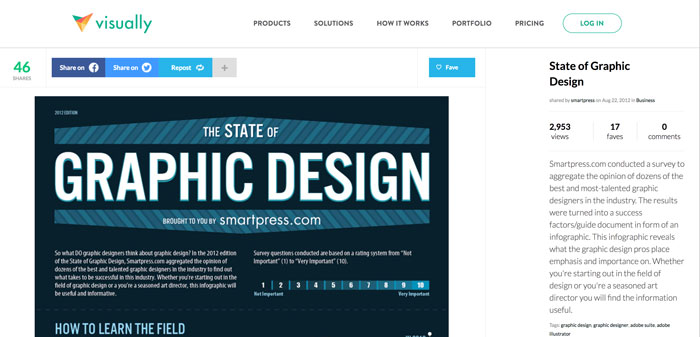
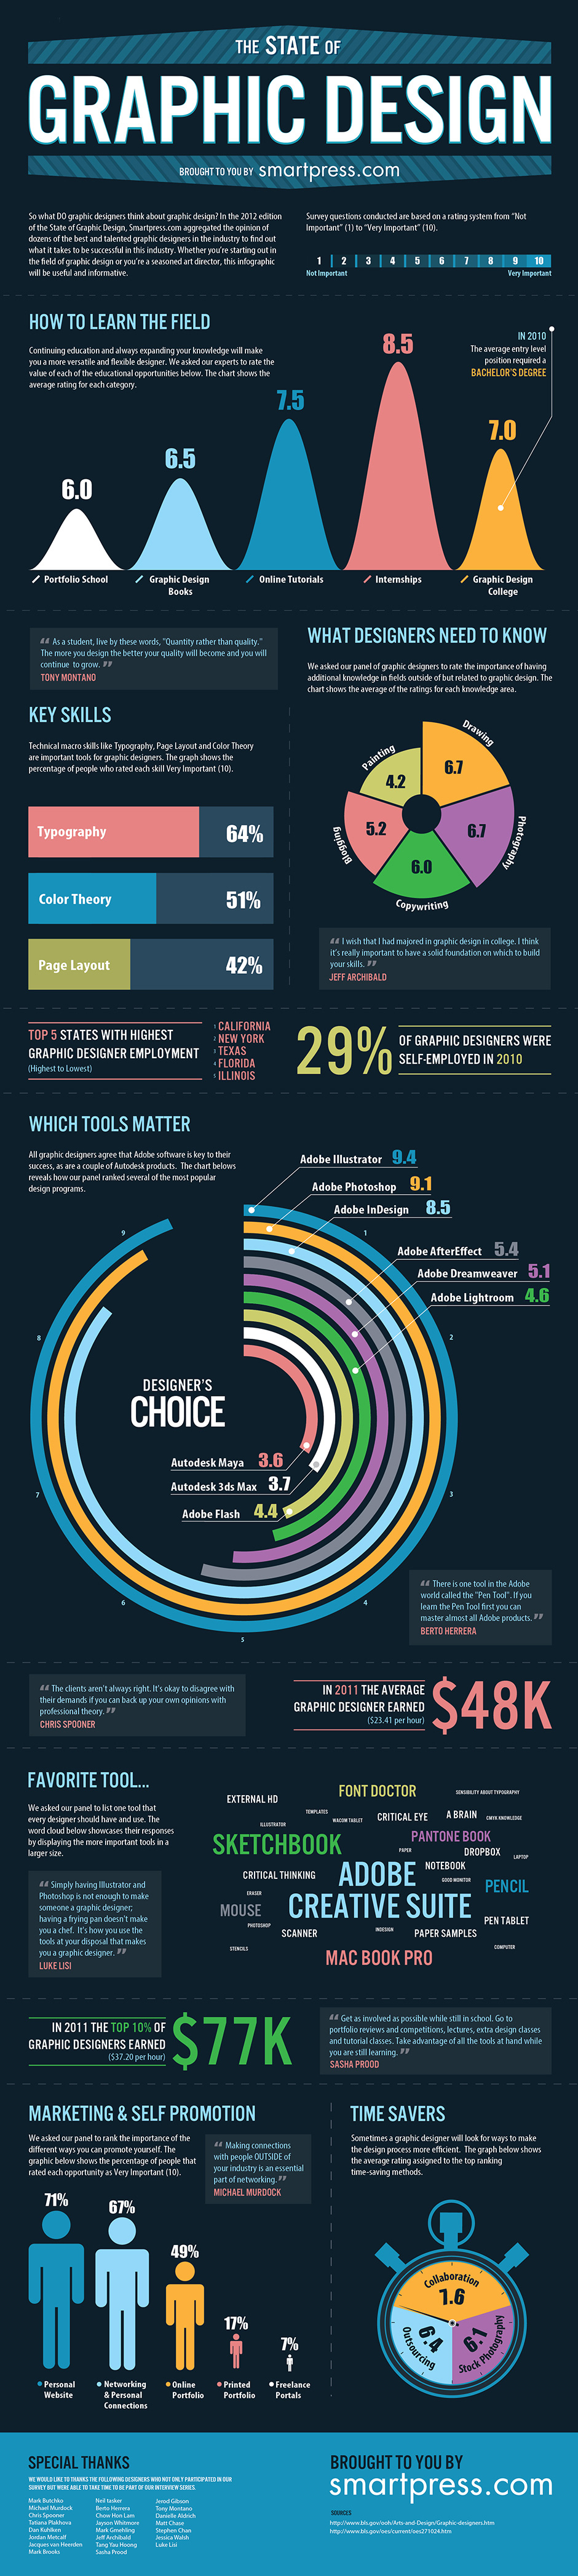
Graphic design experts were surveyed and shared their knowledge and experience for this infographic. Smartpress.com conducted a survey to gather opinions of top talent in the graphic design industry. The results were turned into a success factors/guide document in form of an infographic. Survey included more than 40 industry experts that have 5+ years of experience.
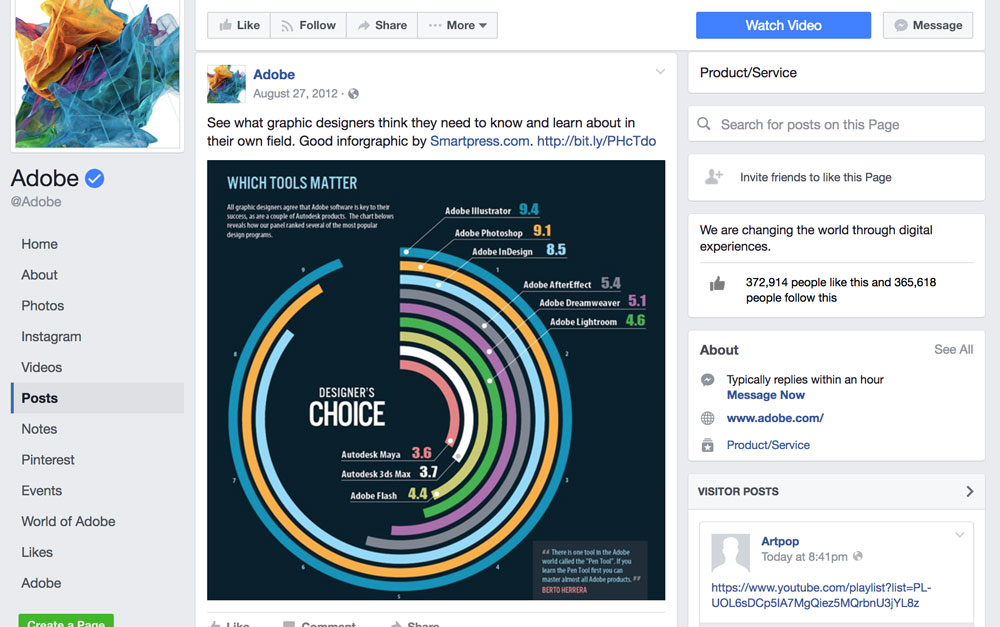
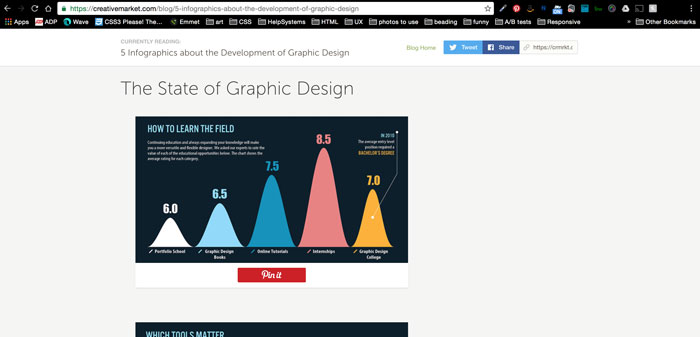
In addition to Adobe, this was had a lot of traffic on Visual.ly and was showcased in a great post on Creative Market.
This infographic revealed what the graphic design experts place emphasis and importance on. For new designers or seasoned art directors, or anyone in between, this infographic featured useful information about the field of graphic design.
Role in Project
Responsible for designing the infographic. Data was presented in an easy-to-read format for graphic designers. Made sure the infographic was easy to read and moved the eye through the graphic. Contrast was an important factor in this graphic and that was established first during the design process. Because type was on a dark background, it was important that there was a lot of contrast so all content was legible.
Chart types were carefully chosen to best convey the numbers. At a glance, these charts tell a story, so user is not forced to read all the content. Designers are busy people, so the design really had to be inviting so they would want to spend time learning about their chosen field.
What I Learned
This project served as a great social media lesson. It’s amazing how often this graphic was shared, pinned, embedded, etc. It really goes to show how targeting the right audience had tremendous value and that when you provide great content, it really promotes itself. My only regret was not pushing harder to make an updated version each year. Yes, It was a huge time expense, but it was also great brand recognition. I should have made a better case to get this added into the yearly content schedule. Surveying more designers, following up with the featured designers for more insight, and expanding on the questions asked would have added tremendous value to this infographic series. Pinterest and Instagram would be ideal channels for sharing and connecting with designers. Looking back, this would have been a great opportunity to do a graphic design field retrospective and this had the potential to be something that designers look forward to year after year.